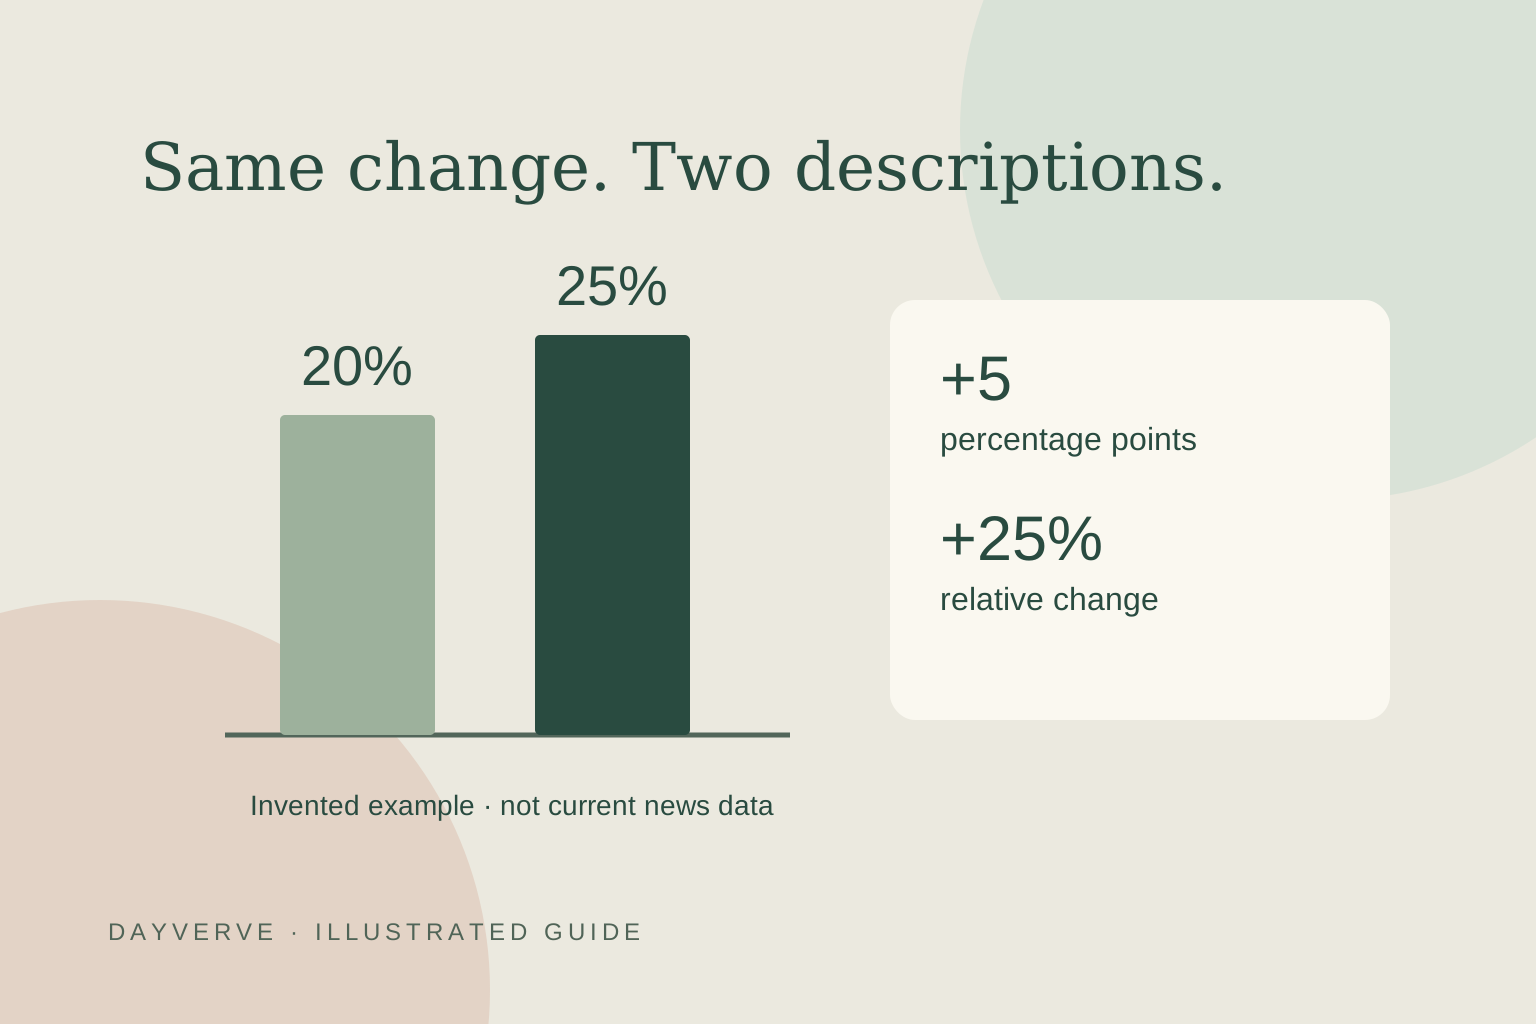
A rise from 20% to 25% is not just a 5% increase.
Two accurate descriptions can make the same change sound very different. Work through the arithmetic, the denominator, and the context before sharing a claim.
 AI-generated illustration
Ask what kind of change the headline describes
“Up five points” and “up twenty-five percent” can describe the same movement. They answer different questions. This guide uses invented numbers to show how the comparison works; none of the examples reports a current poll, company result, or economic release. The useful reading habit is to find the starting value, ending value, and unit before deciding whether a claim is surprising. A calculator helps, but the label on the calculation matters just as much.
Work through one example in two ways
Suppose the share of readers choosing a weekend newsletter moves from 20% to 25%. Subtract the starting percentage from the ending percentage: 25 minus 20 equals 5 percentage points. For relative percentage change, divide the difference by the starting value, then multiply by 100: 5 divided by 20, times 100, equals 25%. So the share rose by 5 percentage points, or 25% relative to its original level. Calling it simply a “5% increase” changes the meaning and can mislead.
Translate both percentages into counts
Imagine the example comes from exactly 200 people in each period. A 20% share means 40 people; 25% means 50 people. The increase is 10 people. This gives you a second way to check the relative change: 10 divided by 40 equals one quarter, or 25%. The counts make the hypothetical story easier to picture. They do not establish why the preference changed. In a real article, look for the actual population, sample, and collection method instead of supplying convenient numbers yourself.
A changing denominator can change the story
Now keep the starting period at 40 out of 200 people, but make the later period 40 out of 160. The share rises from 20% to 25% even though the count stays at 40. A headline about a rising share and a headline about an unchanged count could both be accurate. Before treating either as the whole story, ask “a share of what?” Counts, percentages, and rates should name the group or quantity in their denominator. Changes in that denominator are part of the explanation.
The reverse movement is not a matching percentage
A fall from 25% back to 20% is a drop of 5 percentage points. Its relative change is negative 5 divided by 25, times 100: a 20% decrease. That differs from the earlier 25% increase because the starting value changed. Another invented example makes the pattern visible: a value growing from 80 to 100 rises by 25%, but returning from 100 to 80 falls by 20%. Equal-sized movements need not have equal relative percentages.
Check the chart label and the underlying release
ONS guidance distinguishes percentage change from percentage-point change among the measures a chart can display. When reading a graphic, copy its unit exactly. Is the vertical axis a count, a share, an index, or a change? Check the dates and the group covered, then follow the source to the original table or release. A chart can be mathematically correct while answering a narrower question than the accompanying headline. Keep your conclusion within what the stated measure supports.
Arithmetic alone cannot settle a survey claim
A survey figure is an estimate rather than a complete count of everyone. ONS explains that sampling introduces uncertainty and that measures such as confidence intervals help communicate precision. A small reported movement therefore needs the survey’s own uncertainty and comparison notes before you call it a clear change in the population. Do not invent a margin of error or declare a result statistically significant from the printed percentages alone. Calculating the difference correctly is one part of reading the evidence.
Use a one-minute claim card
Before sharing a number, complete this sentence: “The measure changed from ___ to ___, for ___ people or items, over ___ dates; the stated unit is ___.” If both endpoints are percentages, calculate the percentage-point difference and label any relative change separately. Note whether the denominator changed and whether the release includes uncertainty or revisions. If a detail is missing, say so. “I can calculate the movement, but the article does not identify the sample” is a more useful conclusion than forcing a confident verdict.